Total Fertility Rate in India: Understanding the Numbers vs Reality
Context
- Total Fertility Rate (TFR) has emerged as a significant topic in India due to the gap between actual fertility behavior and statistical TFR calculations.
- This is particularly relevant for a developing country like India, which is undergoing economic, social, and cultural transitions.
- Understanding this gap is crucial for demographic planning, economic forecasting, and policy formulation.
1. Why in News?
- Recent discussions highlight a large discrepancy between real fertility trends and TFR statistics.
- This raises policy-relevant questions about population management, economic growth, and ageing population concerns.
2. UN Report 2025 Findings
- The UN Population Fund (UNFPA) in its State of World Population 2025 report states:
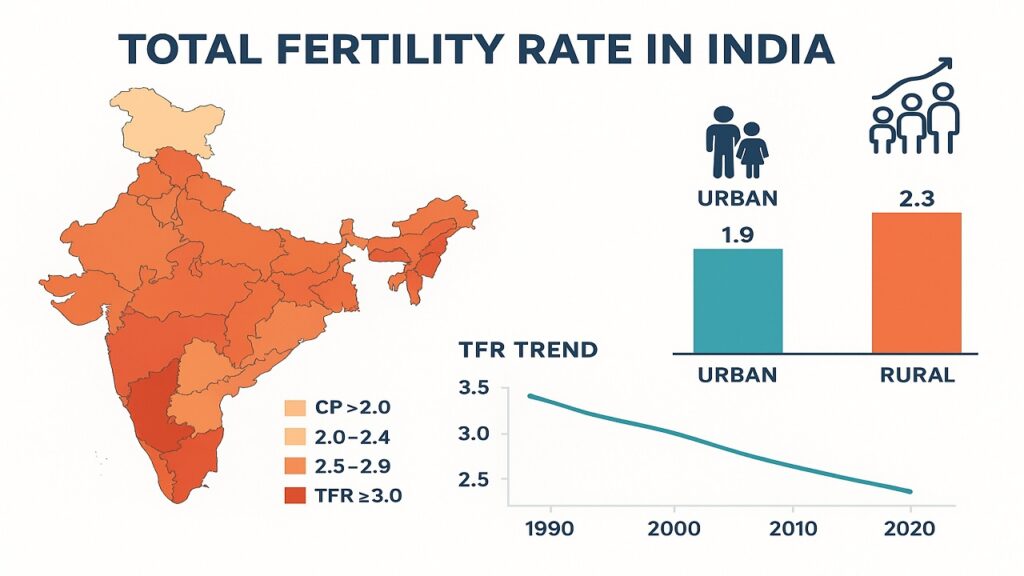
- India’s TFR has fallen to 1.9, below the replacement level of 2.1.
- Sub-replacement fertility has shifted focus from concerns about rapid population growth to issues related to ageing populations.
- Questions Raised by the Report:
- Does the current methodology for TFR calculation reflect real fertility preferences?
- Could the decline in TFR affect India’s economic trajectory, creating a need to raise fertility?
3. Understanding TFR
- Definition: TFR is the average number of children a woman would have in her lifetime based on current age-specific fertility rates (ASFRs).
- Reproductive Age Division: 15–49 years, divided into seven five-year cohorts: 15–19, 20–24, 25–29, 30–34, 35–39, 40–44, 45–49.
- Age-Specific Fertility Rate (ASFR): Number of live births per 1,000 women in each cohort per year.
- TFR Calculation:
- ASFR × 5 ÷ 1,000 for each cohort.
- Sum across all cohorts = Total Fertility Rate.
- Synthetic Cohort Assumption: Assumes that younger women today will follow fertility patterns of older women in the future.
4. Limitations of TFR Calculation
- Assumption vs Reality:
- Real fertility preferences do not always follow synthetic cohort assumptions.
- Younger cohorts often delay childbirth, differing from older women.
- Tempo Effect:
- TFR is sensitive to timing changes in childbearing, not just number of births.
- Postponed births are not captured in current data, artificially lowering TFR.
- This effect is more pronounced when birth postponement is common among younger cohorts.
- Exclusion:
- Births below 15 and above 49 are excluded, which may be inaccurate in countries with early marriages.
- Survey Limitations:
- Legal and social sensitivities may lead to concealed births or skipped questions by enumerators.
5. Urban vs Rural Fertility Trends
- Urban Areas:
- Decline in ASFR among 15–19 and 20–24 cohorts.
- Increase in ASFR among 25–49 cohorts, indicating postponement of childbearing rather than an overall decline.
- Rural Areas:
- Decline in 15–19 cohort, increase in 20–34 cohorts, suggesting delayed fertility.
- Reduction in ASFR among older cohorts (35–49) indicates declining fertility preference in older age groups.
Conclusion
- Historical experience from Europe, the U.S., and newly industrialized economies shows that sub-replacement fertility does not hinder economic progress.
- India’s demographic dividend has been underutilized due to youth unemployment and emerging challenges from automation and AI.
- The current elderly population is largely independent of present fertility trends.
- While state responsibility for elderly care remains, its urgency cannot be inferred solely from TFR decline.
- Policy focus should be on creating social, educational, and economic conditions that naturally influence fertility decisions rather than reacting only to statistical measures.
Source : The Hindu