US at the Top, China Close Behind: India’s Trade Dynamics FY 2024–25
Context : India’s foreign trade in the financial year 2024–25 highlighted two key patterns — a deepening trade relationship with the United States and a persistent trade imbalance with China. These trends reflect both opportunities for growth and structural challenges in India’s external sector.
________________________________________
Overall Trade Snapshot — FY 2024–25
• India’s goods exports remained almost flat at $437.42 billion (compared to $437.07 billion in FY24).
• Imports rose by 7%, reaching a record $915.19 billion.
• The overall trade deficit stood at $94.26 billion, underlining the gap between imports and exports in the merchandise sector.
• Services exports grew by 12.45%, reaching $383.51 billion.
• Services imports stood at $195.95 billion, ensuring India maintained a healthy surplus in this segment.
________________________________________
Sector-Wise Export Performance
• Coffee exports recorded 40% growth, reaching a record $1.8 billion, driven by global shortages and price spikes.
• Electronic goods exports surged 32% to $38 billion, supported by expanding iPhone manufacturing in India.
• Exports of drugs & pharmaceuticals, fruits & vegetables, and cereal preparations saw moderate growth between 5% and 10%.
• Sectors such as gems & jewellery, handicrafts, and chemicals registered a decline of 2–10%.
• Engineering goods exports grew 6.74% on an annual basis, though there was a 4% decline in March.
________________________________________
Challenges for Indian Exports
• Imposition of tariffs by the US on iron & steel and auto components is expected to reduce India’s engineering exports by $4–5 billion annually.
• Rising competition from Chinese exporters in global markets such as Latin America, Africa, and the Middle East could erode the global market share of Indian products.
________________________________________
India–US Trade: A Strengthening Economic Partnership
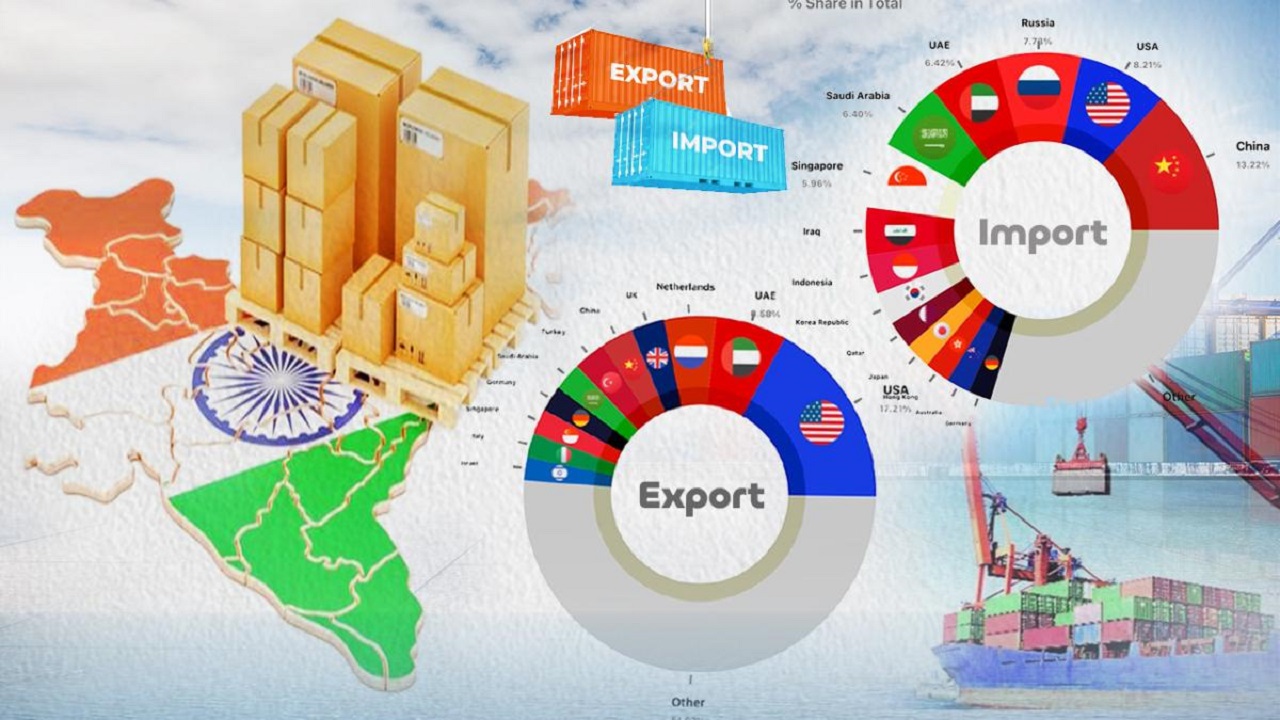
• In 2024–25, the United States remained India’s largest trading partner for the fourth consecutive year.
• Bilateral trade reached $131.84 billion.
• India’s exports to the US rose by 11.6%, standing at $86.51 billion (up from $77.52 billion in FY24).
• Imports from the US increased by 7.44%, totaling $45.33 billion (up from $42.2 billion).
• As a result, India’s trade surplus with the US widened to $41.18 billion (from $35.32 billion in the previous year).
________________________________________
Major Indian Exports to the US (FY 2024–25)
• Drug formulations & biologicals – $8.1 billion
• Telecom instruments – $6.5 billion
• Precious & semi-precious stones – $5.3 billion
• Petroleum products – $4.1 billion
• Gold & precious metal jewellery – $3.2 billion
• Readymade garments (mainly cotton) – $2.8 billion
• Iron & steel products – $2.7 billion
________________________________________
Major US Exports to India (FY 2024–25)
• Crude oil – $4.5 billion
• Petroleum products – $3.6 billion
• Coal & coke – $3.4 billion
• Cut & polished diamonds – $2.6 billion
• Electric machinery – $1.4 billion
• Aircraft, spacecraft & parts – $1.3 billion
• Gold – $1.3 billion
________________________________________
Future Outlook: Expanding India–US Trade
• India and the US are engaged in negotiations for a trade agreement.
• The shared objective is to increase bilateral trade to $500 billion by 2030, from the current level of $191 billion.
________________________________________
India–China Trade: Persistent Deficit Challenge
• China remained India’s second-largest trading partner in 2024–25, with total trade rising to $127.7 billion (up from $118.4 billion in FY24).
• India’s exports to China fell by 14.5%, declining to $14.25 billion.
• Imports from China increased by 11.52%, reaching $113.45 billion.
• This resulted in the trade deficit with China widening by 17% to $99.2 billion (from $85.07 billion the previous year).
________________________________________
Historical Trade Patterns
• China was India’s largest trading partner from 2013–14 to 2017–18 and again in 2020–21.
• Since 2021–22, the United States has held the top position.
• Before China, the United Arab Emirates (UAE) was India’s primary trading partner.
________________________________________
Analysis: Structural Dependence and Competitiveness Issues
• Experts highlight that the growing trade deficit with China is more than a numerical imbalance — it reflects India’s structural dependence on Chinese imports.
• Despite a weaker rupee, India’s exports to China have fallen below FY14 levels, indicating deep-rooted competitiveness concerns in manufacturing and supply chains.
________________________________________
Conclusion
India’s trade profile is evolving, marked by a strong strategic shift towards deepening engagement with the United States and persistent economic reliance on Chinese imports.
While the US offers a route for export growth and surplus generation, the China equation continues to highlight the need for structural reforms in domestic production, value chain integration, and global competitiveness.
India’s trade policies, global alliances, and tariff strategies will play a crucial role in addressing these asymmetries as the country seeks to enhance its economic resilience and geopolitical influence.


Comments (0)